|
Commonwealth of Australia
|
Capital |
Currency | Government system |
Canberra |
Australian Dollar (AUD) |
Parliamentary democracy |
Official language | Region |
Population |
English |
Australia & Oceania |
Census 2021 - 25 422 713 |
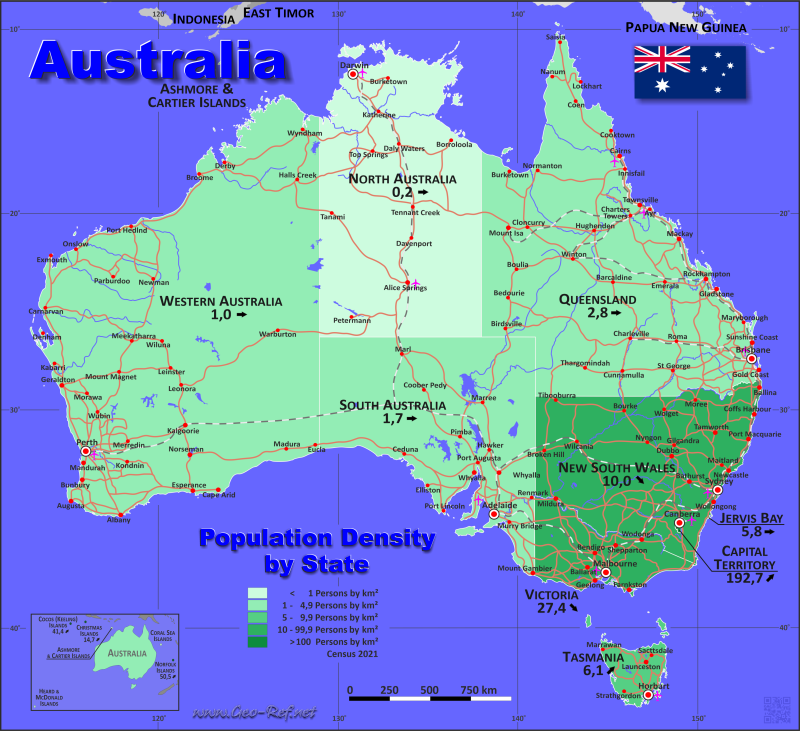
Country map - Administrative structure - Population density of Australia

Australia - Click on the map to get a enlarged image in PDF format!
Other language versions are easy to generate, the description is in an own layer
Conditions for thematic maps with your own data and logotype Delivery as printable file by e-mail or plot by post office |
Layer | |
Province: | yes |
Streets: | yes |
Infrastructure: | yes |
Rivers: | yes |
|
Size | bis A2 |
Supply in | 7 working days |
Price |
1 bis 3 | 65 € |
> 3 | On request |
|
 |
All information published herein is free usable quoting the source, including the maps, if they are not modified |
Statistical Data - Population density according to the administrative structure
The population data in the table below is the census data from 2021, last available data.
Click on the column header brings the table in order of the column header. The default order is the State name.
State |
ISO 3166-2 |
Type |
Capital |
Area (km²) |
Population |
Density (pers/km²) |
Total |
|
|
|
8 883 705 |
25 422 713 |
2,9 |
Last update: 30/04/2023 - 00:26:08 |
Capital Territory |
AU-ACT |
Territory |
Canberra |
2 358 |
454 499 |
192,7 |
Jervis Bay |
AU-JB |
Territory |
Jervis Bay Village |
68 |
397 |
5,8 |
New South Wales |
AU-NSW |
State |
Sydney |
809 444 |
8 072 163 |
10,0 |
Northern Australia |
AU-NT |
Territory |
Darwin |
1 420 970 |
232 605 |
0,2 |
Other Territories |
- |
Territory |
- |
780 707 |
4 307 |
0,0 |
Queensland |
AU-QLD |
State |
Brisbane |
1 852 642 |
5 156 138 |
2,8 |
South Australia |
AU-SA |
State |
Adelaide |
1 043 514 |
1 781 516 |
1,7 |
Tasmania |
AU-TAS |
State |
Hobart |
90 758 |
557 571 |
6,1 |
Victoria |
AU-VIC |
State |
Melbourne |
237 629 |
6 503 491 |
27,4 |
Western Australia |
AU-WA |
State |
Perth |
2 645 615 |
2 660 026 |
1,0 |
The following table illustrate the external territories of Australia.
External Territory |
ISO 3166-2 |
Capital |
Area (km²) |
Population |
Density (pers/km²) |
Total |
|
|
6 677 207 |
5 307 |
0,00 |
Last update: 30/04/2023 - 00:26:08 |
Ashmore and Cartier Islands |
|
|
155 |
0 |
0 |
Australian Antarctic Territory |
AU-AQ |
Davis Station |
5 896 500 |
1 000 |
<0,01 |
Christmas Island |
AU-CX |
Flying Fish Cove |
135 |
1 979 |
14,66 |
Cocos (Keeling) Islands |
AU-CC |
West Island |
14 |
579 |
41,36 |
Coral Sea Islands |
|
Willis Island |
780 000 |
nd |
0 |
Heard Island & McDonald Islands |
AU-HM |
Atlas Cove |
368 |
0 |
0 |
Norfolk Island |
AU-NF |
Kingston |
35 |
1 749 |
50,55 |
Membership in international organisations and treaties
Expand list
Political Alliances
Regional Unions
Military alliances/Arms control
Law enforcement
Business Alliances
Fishery
Financial
Free Trade Area, Internal Market
Technical alliances
Environment
Transport
Cientific
Humanitarian Unions
Cultural Unions
 |
If you have suggestions to include other information or you find missed links, please inform us!
Click here ... |
|
Fast selection
List of international organisations and treaties
News Covid-19
Numbers from MS Bing
Existing thematical maps
|