Kingdom of Belgium
| Capital |
Currency | Government system |
|---|
| Brussels |
Euro (EUR) |
Constitutional hereditary monarchy |
| Official language | Region |
Population |
|---|
Dutch
French
German |
Europe |
Estimation 2025
11 825 551 |
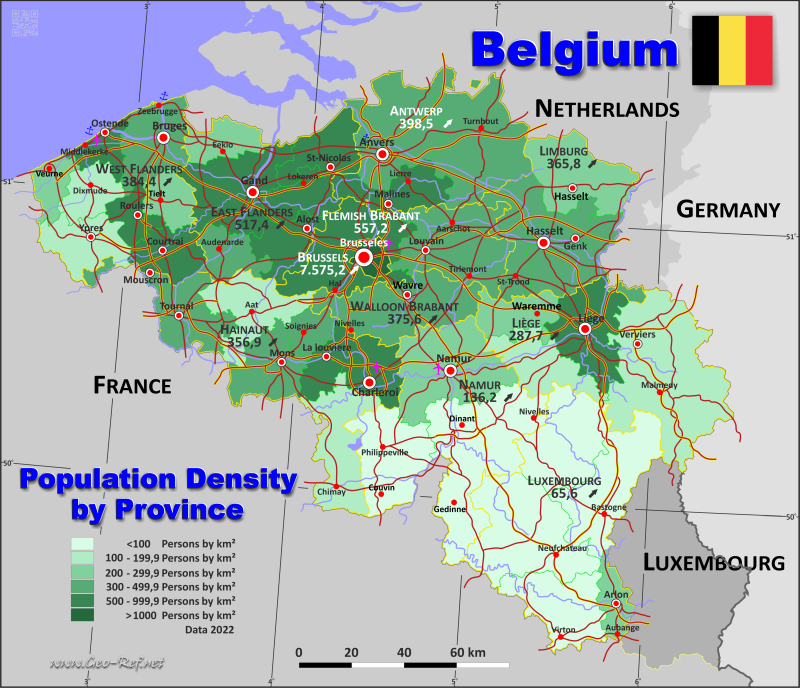
Country map - Administrative structure - Population density of Belgium
Belgium map - Click the map to get map as PDF file.
Other language versions are easy to generate, the descriptions are in own layers
Conditions for thematic maps with your own data and logotype
Delivery as printable file by e-mail or plot by post office
|
|---|
| Layers | |
| Provinces: | yes |
| Streets: | yes |
| Infrastructure: | yes |
| Rivers: | yes |
|
| Size | Till A2 |
| Delivery time | 7 working days | | Price |
| 1 bis 3 | 75 € | | > 3 | On request |
|
 |
All information published herein is free usable quoting the source,
including the maps, if they are not modified
|
|---|
Statistical data - Population density according to the administrative structure
The population data of the table below is an estimation form 2025, based on the census 2012.
Click on the column header brings the table in order of the column header.
The default order is the province name.
| Province |
ISO
3166-2 |
Capital |
Area
(km²) |
Population |
Density
(pers/km²) |
| Total |
|
|
30 547 |
11 825 551 |
387,1 |
|---|
| Last update: 07/14/2025 - 01:31:15 |
|---|
| Antwerp |
BE-VAN |
Antwerpen |
2 849 |
1 921 189 |
674,3 |
| Brussels |
- |
- |
162 |
1 255 795 |
7 751,8 |
| East Flanders |
BE-VOV |
Gent |
3 000 |
1 602 532 |
534,2 |
| Flemish Brabant |
BE-VBR |
Leuven |
2 118 |
1 204 541 |
568,7 |
| Hainaut |
BE-WHT |
Mons |
3 786 |
1 365 328 |
360,6 |
| Liège |
BE-WLG |
Liège |
3 862 |
1 122 925 |
290,8 |
| Limburg |
BE-VLI |
Hasselt |
2 422 |
904 919 |
373,6 |
| Luxembourg |
BE-WLX |
Arlon |
4 440 |
296 008 |
66,7 |
| Namur |
BE-WNA |
Namur |
3 666 |
505 348 |
137,8 |
| Walloon Brabant |
BE-WBR |
Wavre |
1 097 |
415 381 |
378,7 |
| West Flanders |
BE-VWV |
Brugge |
3 145 |
1 231 585 |
391,6 |
The provinces of Belgium are divided into arrondissements, which are shown in the following table in their assignment to the provinces. Since there are no ISO 3166 data for the arrondissements, instead the HASC codes are given .
| Arrondissement |
HASC |
Province |
Capital
| Area
(km²) |
Population |
Density
(pers/km²) |
| Total |
|
|
|
30 547 |
11 825 551 |
387,1 |
|---|
| Last update: 07/14/2025 - 01:31:15 |
|---|
| Aalst |
OV.AL |
East Flanders |
Aalst |
469 |
307 426 |
655,5 |
| Antwerpen |
AN.AW |
Antwerpen |
Antwerpen |
982 |
1 076 745 |
1 096,5 |
| Arlon |
LX.AR |
Luxembourg |
Arlon |
317 |
65 902 |
207,9 |
| Ath |
HT.AT |
Hainaut |
Ath |
668 |
130 759 |
195,7 |
| Bastogne |
LX.BS |
Luxembourg |
Bastogne |
1 043 |
51 132 |
49,0 |
| Brugge |
WV.BG |
West Flanders |
Brugge |
661 |
287 473 |
434,9 |
| Brussel |
BU.BR |
Brussel |
Brussel |
162 |
1 255 795 |
7 751,8 |
| Charleroi |
HT.CR |
Hainaut |
Charleroi |
472 |
401 979 |
851,7 |
| Dendermonde |
OV.DM |
East Flanders |
Dendermonde |
342 |
208 435 |
609,5 |
| Diksmuide |
WV.DK |
West Flanders |
Diksmuide |
362 |
52 728 |
145,7 |
| Dinant |
NA.DN |
Namur |
Dinant |
1 592 |
113 374 |
71,2 |
| Eeklo |
OV.EK |
East Flanders |
Eeklo |
334 |
89 465 |
267,9 |
| Gent |
OV.GT |
East Flanders |
Gent |
906 |
575 887 |
635,6 |
| Halle-Vilvoorde |
VB.HV |
Flemish Brabant |
Halle-Vilvoorde |
949 |
673 503 |
709,7 |
| Hasselt |
LI.HS |
Limburg |
Hasselt |
915 |
442 586 |
483,7 |
| Huy |
LG.HY |
Liège |
Huy |
659 |
116 245 |
176,4 |
| Ieper |
WV.IP |
West Flanders |
Ieper |
550 |
108 402 |
197,1 |
| Kortrijk |
WV.KR |
West Flanders |
Kortrijk |
403 |
304 450 |
755,5 |
| La Louvière |
HT.MC |
Hainaut |
Mouscron |
218 |
142 518 |
653,8 |
| Leuven |
VB.LV |
Flemish Brabant |
Leuven |
1 169 |
531 038 |
454,3 |
| Liège |
LG.LG |
Liège |
Liège |
797 |
631 023 |
791,7 |
| Maaseik |
LI.MS |
Limburg |
Maaseik |
909 |
259 943 |
286,0 |
| Marche-en-Famenne |
LX.MR |
Luxembourg |
Marche-en-Famenne |
954 |
57 633 |
60,4 |
| Mechelen |
AN.MH |
Antwerpen |
Mechelen |
510 |
361 424 |
708,7 |
| Mons |
HT.MN |
Hainaut |
Mons |
584 |
261 825 |
448,3 |
| Namur |
NA.NM |
Namur |
Namur |
1 165 |
325 141 |
279,1 |
| Neufchâteau |
LX.NC |
Luxembourg |
Neufchâteau |
1 355 |
66 132 |
48,8 |
| Nivelles |
BW.NV |
Walloon Brabant |
Nivelles |
1 097 |
415 381 |
378,7 |
| Oostende |
WV.OS |
West Flanders |
Oostende |
292 |
160 633 |
550,1 |
| Oudenaarde |
OV.OD |
East Flanders |
Oudenaarde |
419 |
128 606 |
306,9 |
| Philippeville |
NA.PV |
Namur |
Philippeville |
909 |
66 833 |
73,5 |
| Roeselare |
WV.RS |
West Flanders |
Roeselare |
272 |
160 636 |
590,6 |
| Sint-Niklaas |
OV.SN |
East Flanders |
Sint-Niklaas |
530 |
292 713 |
552,3 |
| Soignies |
HT.SG |
Hainaut |
Soignies |
355 |
109 017 |
307,1 |
| Thuin |
HT.TN |
Hainaut |
Thuin |
780 |
92 646 |
118,8 |
| Tielt |
WV.TL |
West Flanders |
Tielt |
330 |
96 116 |
291,3 |
| Tongeren |
LI.TG |
Limburg |
Tongeren |
598 |
202 390 |
338,4 |
| Tournai - Mouscron |
HT.TR |
Hainaut |
Tournai |
709 |
226 584 |
319,6 |
| Turnhout |
AN.TH |
Antwerpen |
Turnhout |
1 357 |
483 020 |
355,9 |
| Verviers |
LG.VV |
Liège |
Verviers |
2 016 |
291 525 |
144,6 |
| Veurne |
WV.VR |
West Flanders |
Veurne |
275 |
61 147 |
222,4 |
| Virton |
LX.VT |
Luxembourg |
Virton |
771 |
55 209 |
71,6 |
| Waremme |
LG.WR |
Liège |
Waremme |
390 |
84 132 |
215,7 |
Existing thematic maps
|
External links change quickly - If you get a link error - Please inform us!
 |
Membership in international organisations and treaties
Expand list
Political Alliances
Regional Unions
Military alliances/Arms control
Law enforcement
Business Alliances
Fishery
Financial
Free Trade Area, Internal Market
Technical alliances
Environment
Transport
Cientific
Humanitarian Unions
Cultural Unions
|
|
If you have suggestions to include other information or you find missed links, please inform us!
Click here ... |
International Border disputes
Expand list
See also neighboring states
|
| |