People's Democratic Republic of Algeria
| Capital |
Currency | Government system |
|---|
| Algiers |
Dinar (DZD) |
Semi-presidential system |
| Official language | Region |
Population |
|---|
Arabic
Berber |
Africa |
Estimation 2025
42 960 740 |
Country map - Administrative structure - Population density of Algeria
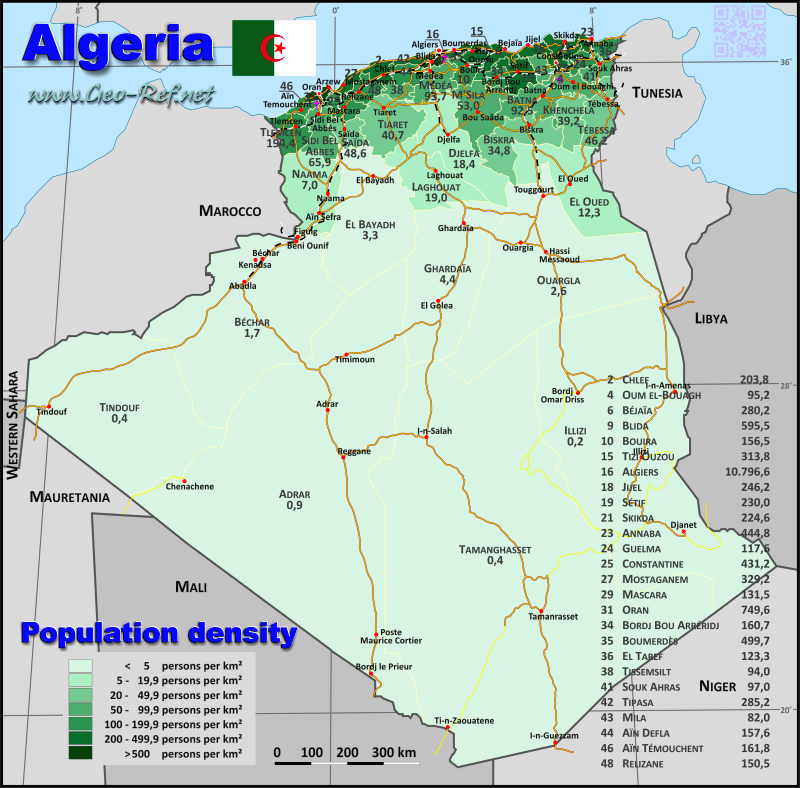
Algeria map - Click the map to get map as PDF file.
Other language versions are easy to generate, the descriptions are in own layers
Conditions for thematic maps with your own data and logotype
Delivery as printable file by e-mail or plot by post office
|
|---|
| Layers | |
| Provinces: | yes |
| Streets: | yes |
| Infrastructure: | yes |
| Rivers: | yes |
|
| Size | Till A2 |
| Delivery time | 7 working days | | Price |
| 1 bis 3 | 85 € | | > 3 | On request |
|
 |
All information published herein is free usable quoting the source,
including the maps, if they are not modified
|
|---|
Statistical data - Population density according to the administrative structure
The population data of the table below is an estimation form 2025, based on the census 2008.
Click on the column header brings the table in order of the column header.
The default order is the province name.
| Province |
ISO
3166-2 |
Capital |
Area
(km²) |
Population |
Density
(pers/km²) |
| Total |
|
|
3 145 987 |
42 960 740 |
13,7 |
|---|
| Last update: 11/30/2025 - 10:50:55 |
|---|
| Adrar |
01 |
Adrar |
427 000 |
504 000 |
1,2 |
| Aflou |
59 |
Aflou |
2 000 |
100 000 |
50,0 |
| Aïn Defla |
44 |
Aïn Defla |
4 897 |
800 000 |
163,4 |
| Aïn Oussera |
60 |
Aïn Oussera |
2 500 |
120 000 |
48,0 |
| Aïn Témouchent |
46 |
Aïn Témouchent |
2 239 |
400 000 |
178,7 |
| Algier |
16 |
Algier |
865 |
4 200 000 |
4 855,5 |
| Annaba |
23 |
Annaba |
1 439 |
640 000 |
444,8 |
| Barika |
61 |
Barika |
1 800 |
110 000 |
61,1 |
| Batna |
05 |
Batna |
12 192 |
1 320 000 |
108,3 |
| Béchar |
08 |
Béchar |
161 400 |
320 000 |
2,0 |
| Béjaïa |
06 |
Béjaïa |
3 268 |
1 100 000 |
336,6 |
| Beni Abbès |
52 |
Beni Abbès |
131 220 |
60 000 |
0,5 |
| Bir el-Ater |
62 |
Bir el-Ater |
3 000 |
90 000 |
30,0 |
| Biskra |
07 |
Biskra |
20 986 |
960 000 |
45,7 |
| Blida |
09 |
Blida |
1 479 |
1 120 000 |
757,3 |
| Bordj Badji Mokhtar |
50 |
Bordj Badji Mokhtar |
120 000 |
50 000 |
0,4 |
| Bordj Bou Arreridj |
34 |
Bordj Bou Arreridj |
3 644 |
700 000 |
192,1 |
| Bou Saâda |
63 |
Bou Saâda |
3 500 |
130 000 |
37,1 |
| Bouira |
10 |
Bouira |
4 439 |
720 000 |
162,2 |
| Boumerdès |
35 |
Boumerdès |
1 456 |
900 000 |
618,1 |
| Chlef |
02 |
Chlef |
4 020 |
1 100 000 |
273,6 |
| Constantine |
25 |
Constantine |
2 187 |
1 100 000 |
503,0 |
| Djanet |
56 |
Djanet |
131 220 |
50 000 |
0,4 |
| Djelfa |
17 |
Djelfa |
66 415 |
1 230 000 |
18,5 |
| El Abiodh Sidi Cheikh |
64 |
El Abiodh Sidi Cheikh |
66 415 |
1 092 184 |
16,4 |
| El Aricha |
65 |
El Aricha |
4 000 |
80 000 |
20,0 |
| El Bayadh |
32 |
El Bayadh |
2 200 |
70 000 |
31,8 |
| El Kantara |
66 |
El Kantara |
78 870 |
228 624 |
2,9 |
| El Meniaa |
58 |
El Meniaa |
131 220 |
150 000 |
1,1 |
| El M'Ghair |
57 |
El M'Ghair |
8 835 |
200 000 |
22,6 |
| El Oued |
39 |
El Oued |
54 573 |
700 000 |
12,8 |
| El Tarf |
36 |
El Tarf |
2 584 |
500 000 |
193,5 |
| Ghardaïa |
47 |
Ghardaïa |
21 224 |
500 000 |
23,6 |
| Guelma |
24 |
Guelma |
4 101 |
510 000 |
124,4 |
| Illizi |
33 |
Illizi |
284 618 |
60 000 |
0,2 |
| In Guezzam |
54 |
In Guezzam |
131 220 |
30 000 |
0,2 |
| In Salah |
53 |
In Salah |
131 220 |
60 000 |
0,5 |
| Jijel |
18 |
Jijel |
2 577 |
720 000 |
279,4 |
| Khenchela |
40 |
Khenchela |
9 811 |
400 000 |
40,8 |
| Ksar Chellala |
67 |
Ksar Chellala |
2 800 |
85 000 |
30,4 |
| Ksar El Boukhari |
68 |
Ksar El Boukhari |
2 600 |
95 000 |
36,5 |
| Laghouat |
03 |
Laghouat |
25 057 |
620 000 |
24,7 |
| Mascara |
29 |
Mascara |
5 941 |
820 000 |
138,0 |
| Medea |
26 |
Medea |
8 866 |
1 020 000 |
115,0 |
| Messaad |
69 |
Messaad |
8 866 |
819 932 |
92,5 |
| Mila |
43 |
Mila |
3 507 |
600 000 |
171,1 |
| Mostaganem |
27 |
Mostaganem |
2 175 |
820 000 |
377,0 |
| M'Sila |
28 |
M'Sila |
18 175 |
1 210 000 |
66,6 |
| Naâma |
45 |
Naâma |
29 950 |
200 000 |
6,7 |
| Oran |
31 |
Oran |
2 114 |
1 600 000 |
756,9 |
| Ouargla |
30 |
Ouargla |
211 980 |
700 000 |
3,3 |
| Ouled Djellal |
51 |
Ouled Djellal |
131 220 |
200 000 |
1,5 |
| Oum El Bouaghi |
04 |
Oum El Bouaghi |
6 768 |
520 000 |
76,8 |
| Relizane |
48 |
Relizane |
4 870 |
800 000 |
164,3 |
| Saida |
20 |
Saida |
6 764 |
360 000 |
53,2 |
| Setif |
19 |
Setif |
6 543 |
1 600 000 |
244,5 |
| Sidi Bel Abbès |
22 |
Sidi Bel Abbès |
9 096 |
1 120 000 |
123,1 |
| Skikda |
21 |
Skikda |
4 026 |
900 000 |
223,5 |
| Souk Ahras |
41 |
Souk Ahras |
4 360 |
500 000 |
114,7 |
| Tamanrasset |
11 |
Tamanrasset |
557 000 |
210 000 |
0,4 |
| Tébessa |
12 |
Tébessa |
14 227 |
660 000 |
46,4 |
| Tiaret |
14 |
Tiaret |
20 673 |
910 000 |
44,0 |
| Timimoun |
49 |
Timimoun |
131 220 |
100 000 |
0,8 |
| Tindouf |
37 |
Tindouf |
159 000 |
50 000 |
0,3 |
| Tipaza |
42 |
Tipaza |
2 166 |
700 000 |
323,2 |
| Tissemsilt |
38 |
Tissemsilt |
3 152 |
400 000 |
126,9 |
| Tizi Ouzou |
15 |
Tizi Ouzou |
2 956 |
1 300 000 |
439,8 |
| Tlemcen |
13 |
Tlemcen |
9 061 |
1 220 000 |
134,6 |
| Touggourt |
55 |
Touggourt |
131 220 |
200 000 |
1,5 |
Critical data analysis
Since the 2008 census, we have had no access to data
from Algeria on population density and distribution. In the meantime, there
have been two further (of four) territorial reforms, as well as significant
population growth. In 2019, 10 additional provinces were defined (this
territorial structure is shown on the map), and another 11 in 2025. No
geographical representations or descriptions could be found for the
provinces established in 2025; these are to be published in the future in
the official information provided by the Algerian government.
However, an analysis of the population structure
already shows population data for the 11 new provinces, which is also
unclear in the table. It is unclear whether this data – population and area
– has been deducted from the data of the previously divided provinces or
not. The area data differs from previous data (50%), at least in terms of
the total area of the country.
However, we have decided to publish the data despite
these contradictions, as the population growth since 2008 – approximately
17% – is plausible, at least for the provinces that existed until 2019.
As soon as accurate official data is available, the
data presented here will be updated.
Existing thematic maps
|
External links change quickly - If you get a link error - Please inform us!
 |
Membership in international organisations and treaties
Expand list
Political Alliances
Regional Unions
Military alliances/Arms control
Law enforcement
Business Alliances
Fishery
Financial
Free Trade Area, Internal Market
Technical alliances
Transport
Cientific
Humanitarian Unions
Cultural Unions
|
|
If you have suggestions to include other information or you find missed links, please inform us!
Click here ... |
International Border disputes
Expand list
See also neighboring states
|
| |